Hi, I'm Drew. Welcome to my boneless, gluten-free, fair trade website! I am an incoming assistant professor of environmental studies at Oberlin College; also, I keep the old gods. Navigate this site as follows:

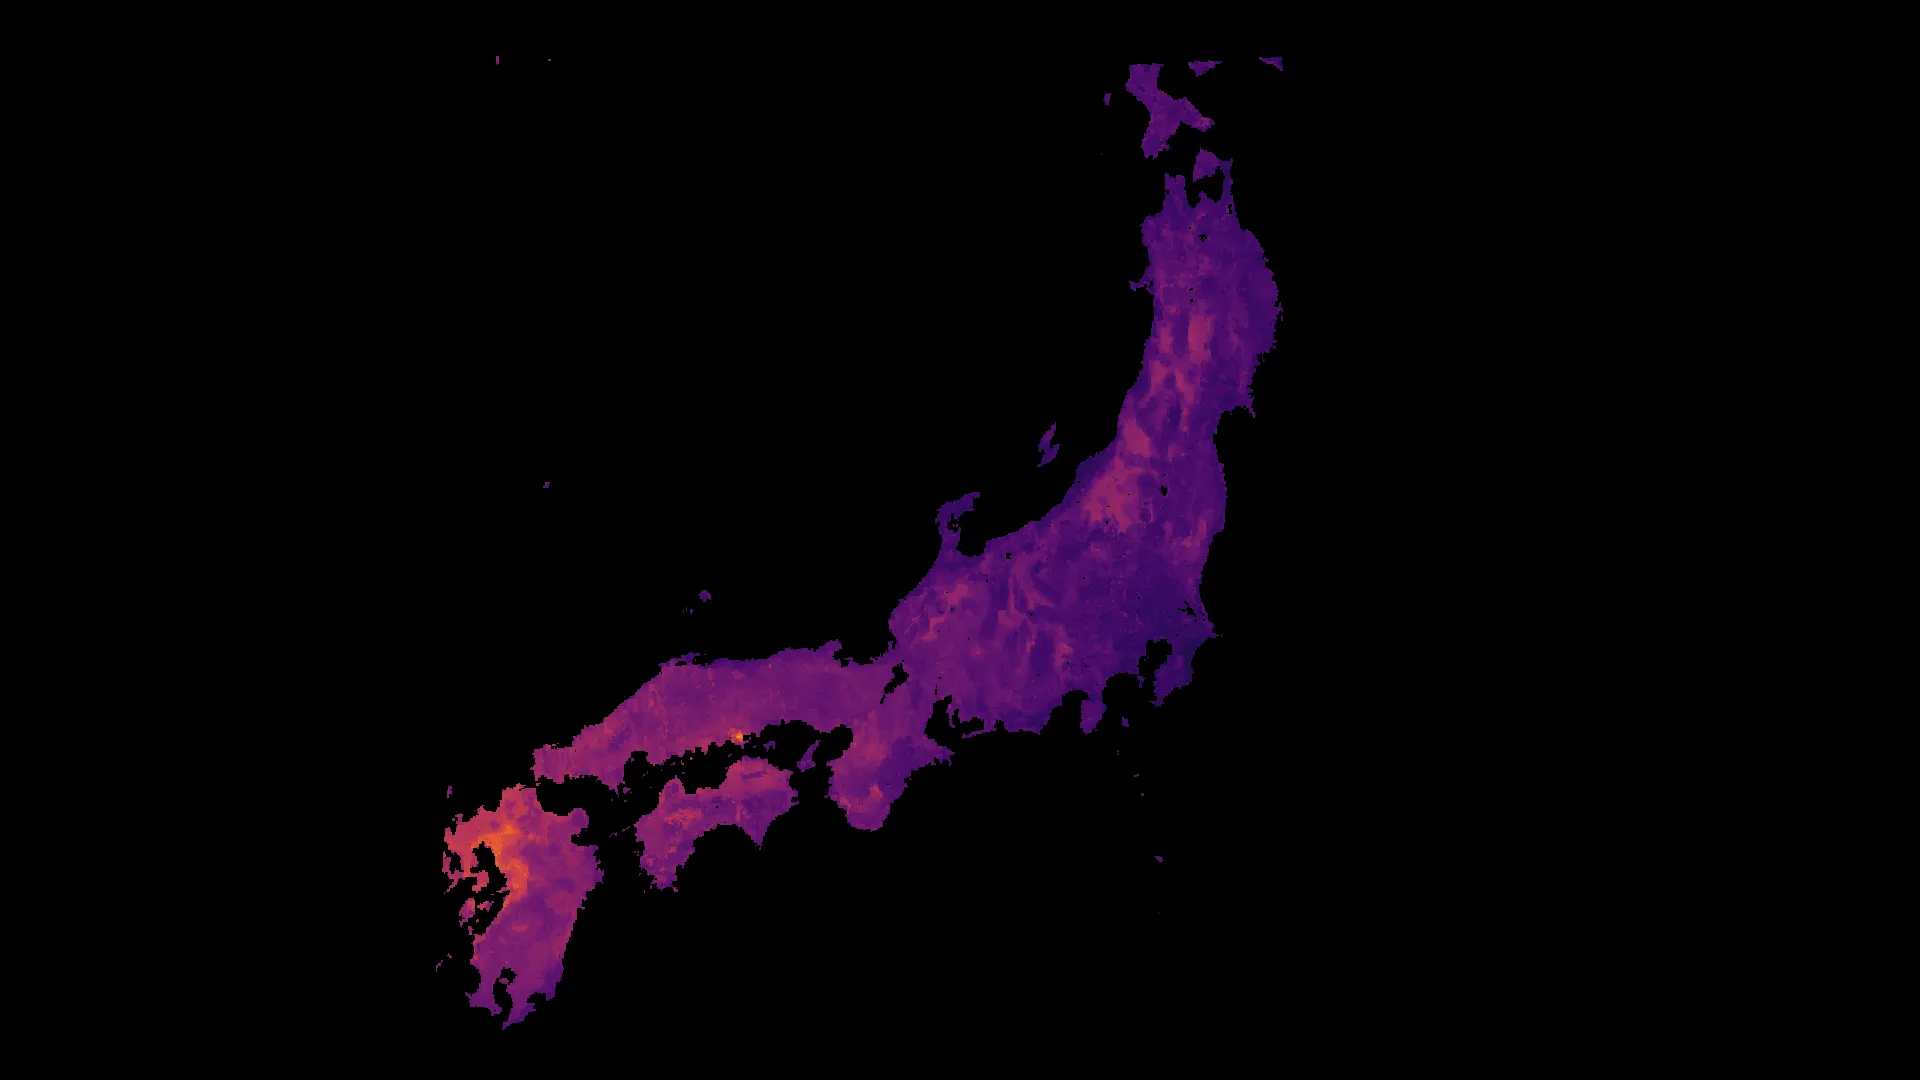
- If you are interested in my SCIENTIFIC WORK: I use satellite data to track pollution back to its source, monitor emissions, and diagnose the drivers of pollution change. For the details, check out out my ongoing projects, research papers, conference presentations, open-source software, and datasets. For general-audience explanations of some key findings, you can read my newsletter.
- If you are interested in my INTERDISCIPLINARY WORK: I work broadly on imagining institutions and protocols that advance economic democracy within planetary boundaries, with an emphasis on connecting science with (1) social movements and (2) economic planning. This work has taken the form of books, public writing, academic publications, and video games.
- If you are interested in MY CV: you can download it here.
- If you are interested in MISCELLANEOUS: This website is big because I have had it since high school and I don't delete things. On it, you can find ephemera I have made over the years, including essays and reporting and original music. For the full experience of this randomly-generated website, reload a bunch of times.
- If you are interested in CONTACT: I can be reached at drew [at] drewpendergrass [dot] com, at the academic address in my CV, and on my only active socials: Bluesky and LinkedIn. Upcoming events are on my events page, and you can keep up with my work by subscribing to my (infrequent) newsletter below:
Upcoming events
Presentation: 13th Biennial US Society for Ecological Economics Conference (Oberlin, OH)
Date: 19 June 2026 at TBD
Location: Oberlin College
I will be presenting a paper entitled "Beyond prices: multi-criteria signals for a social-ecological transformation" at the USSEE conference on behalf of myself and my co-authors Joël Foramitti, Walther Zeug, and Jakob Heyer.
Lecture: Reducetarian Summit (Raleigh)
Date: 24 October 2026 at TBD
Location: Raleigh Marriott City Center
I will be presenting on trends in ammonia emissions from agriculture at the 2025 Reducetarian Summit in Atlanta, GA. More info here.
Additional events, future and past, are available on my events page.
You can learn more about my research on the projects page, or you can read through all of my scientific papers and presentations on their respective pages.
A featured interdisciplinary project!
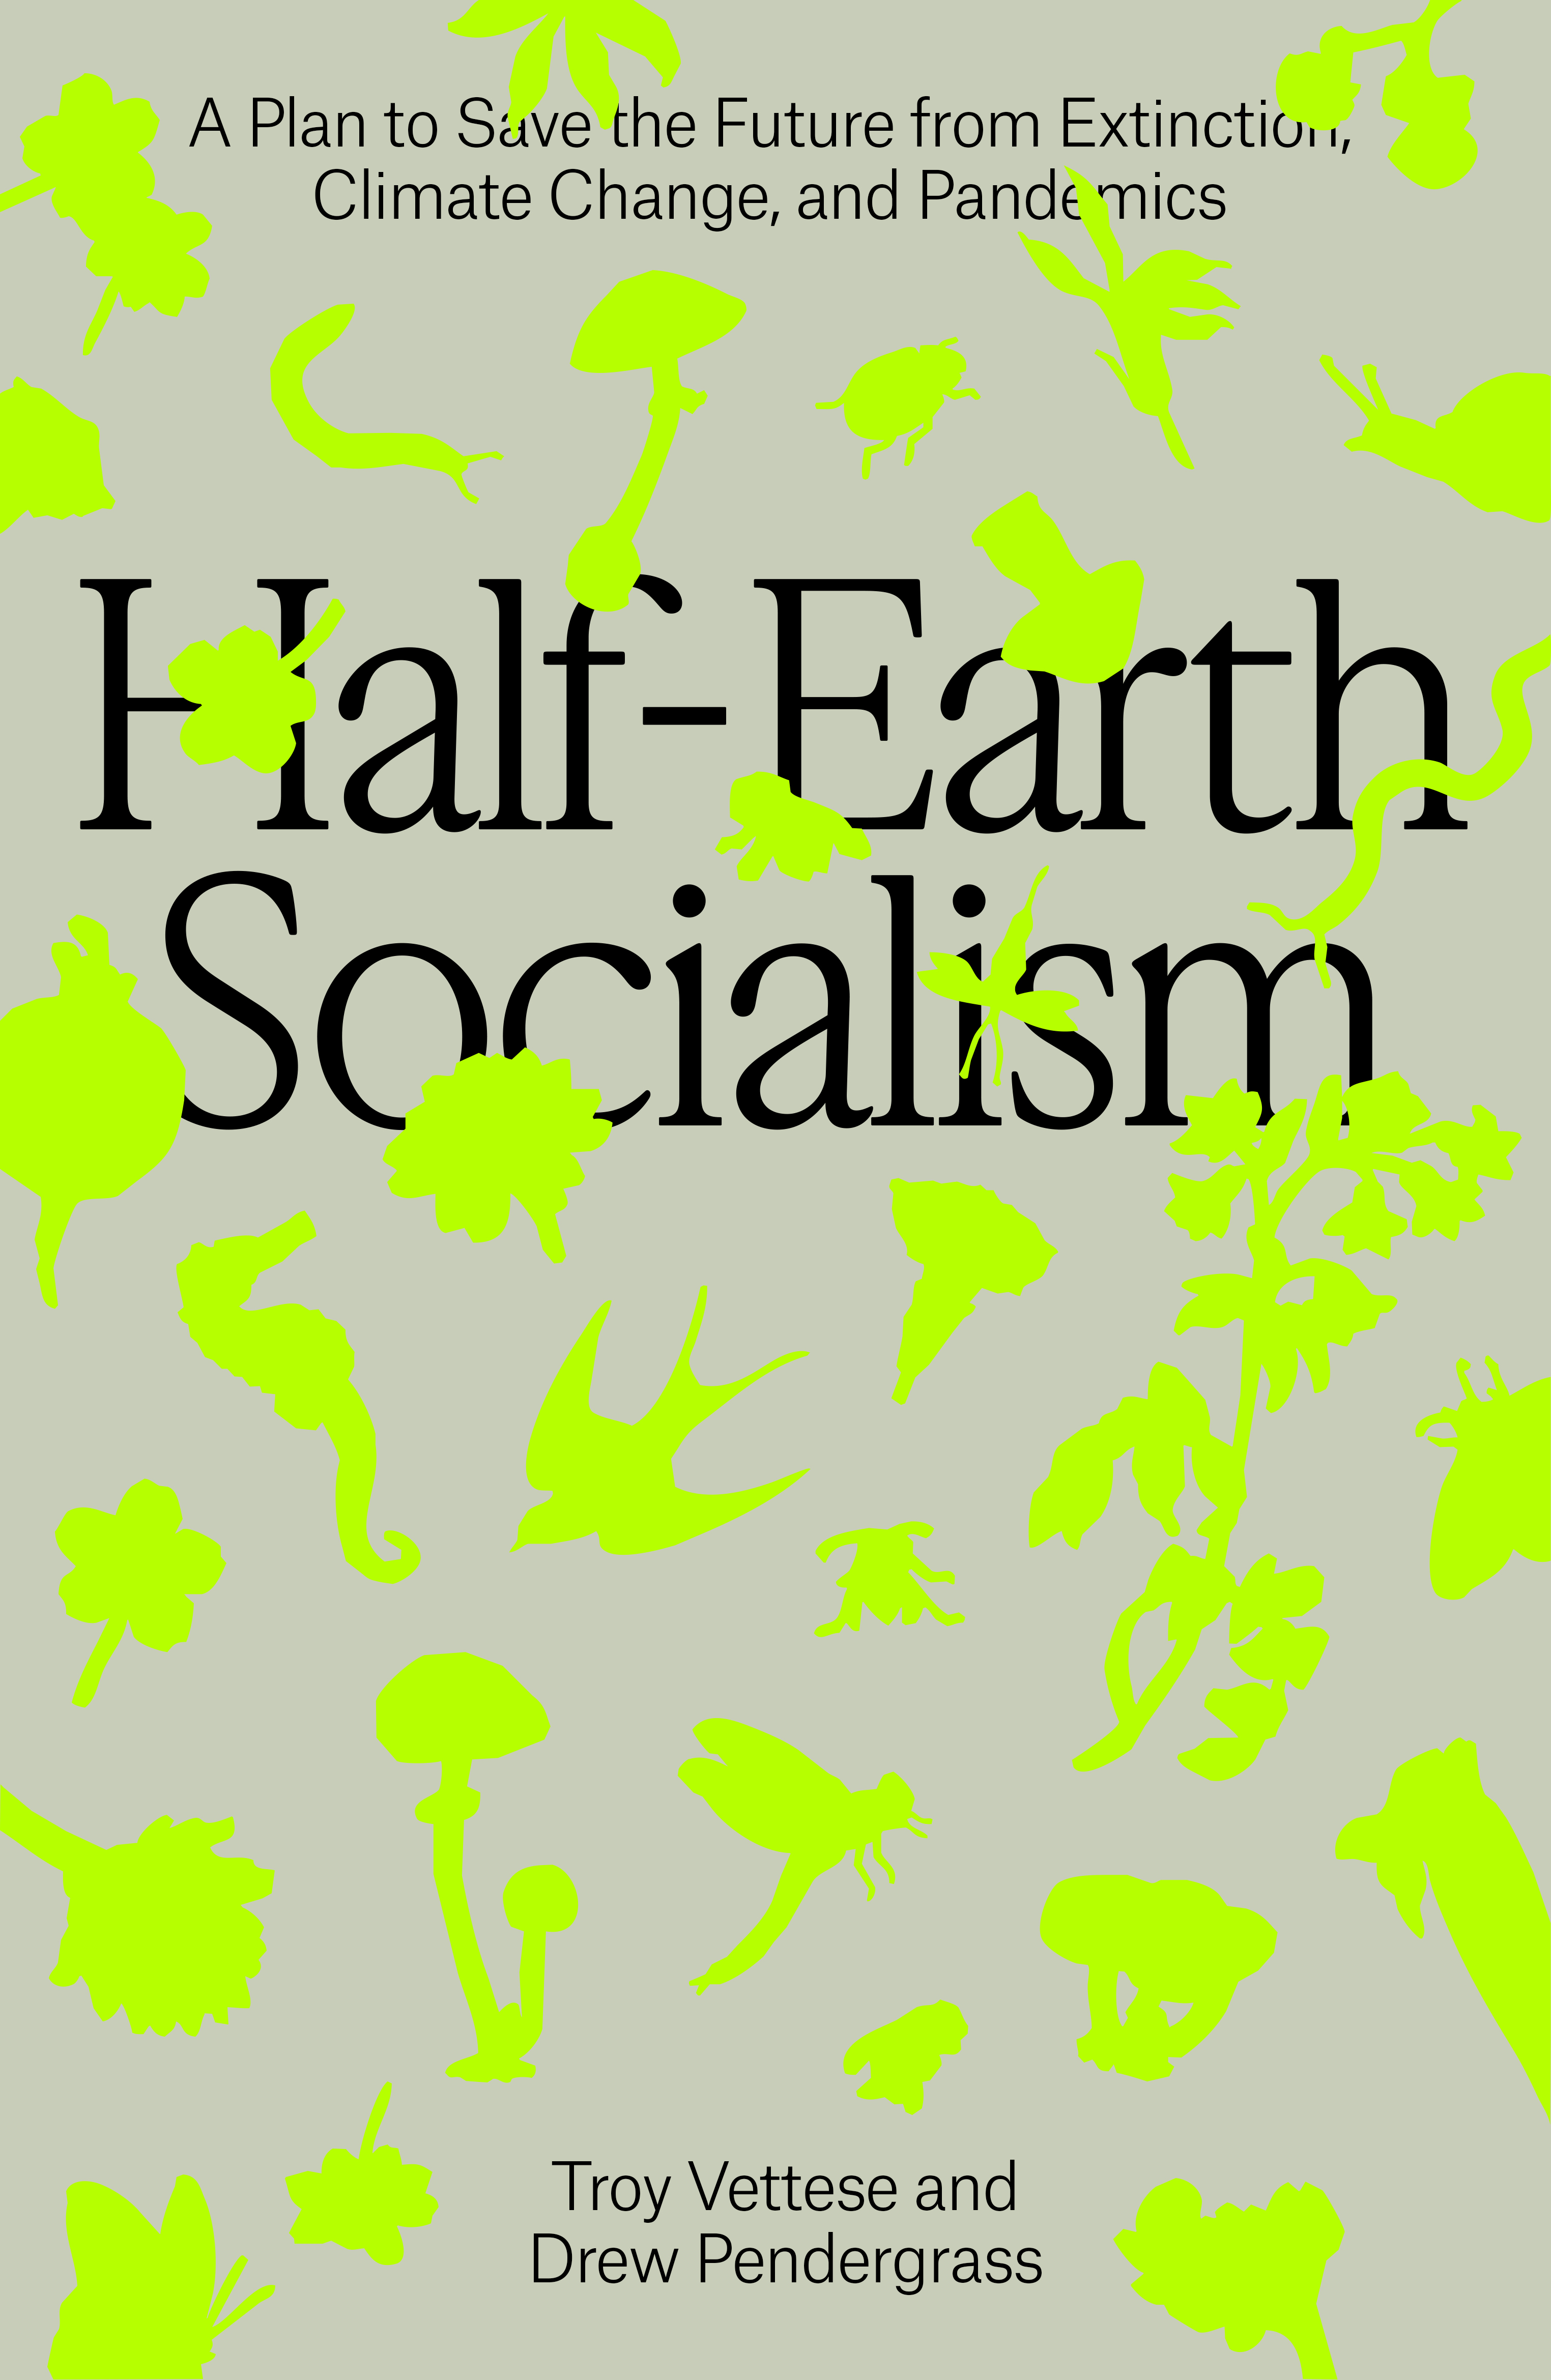
Half-Earth Socialism
Half-Earth Socialism is a book I co-authored with environmental historian Troy Vettese on how we can get out of our current ecological mess. Published in April 2022 by Verso Books, you can order it from the publisher here. The book has been translated into Italian, Thai, Korean, Spanish, and Swedish; all translations can be ordered from my books page.
Pendergrass, D.C. and Vettese, T.G.W (2022). Half-Earth Socialism: A Plan to Save the Future from Extinction, Climate Change and Pandemics. Verso Books. | Read it here.
Read more about my books here, or see all featured interdisciplinary projects on my projects page.
A random media appearance
Majority Report (video)
19 April 2022 | Watch here
My co-author Troy Vettese and I spoke with Emma Vigeland of the Majority Report about our book Half-Earth Socialism.
Additional interviews and media are available on my interviews page.
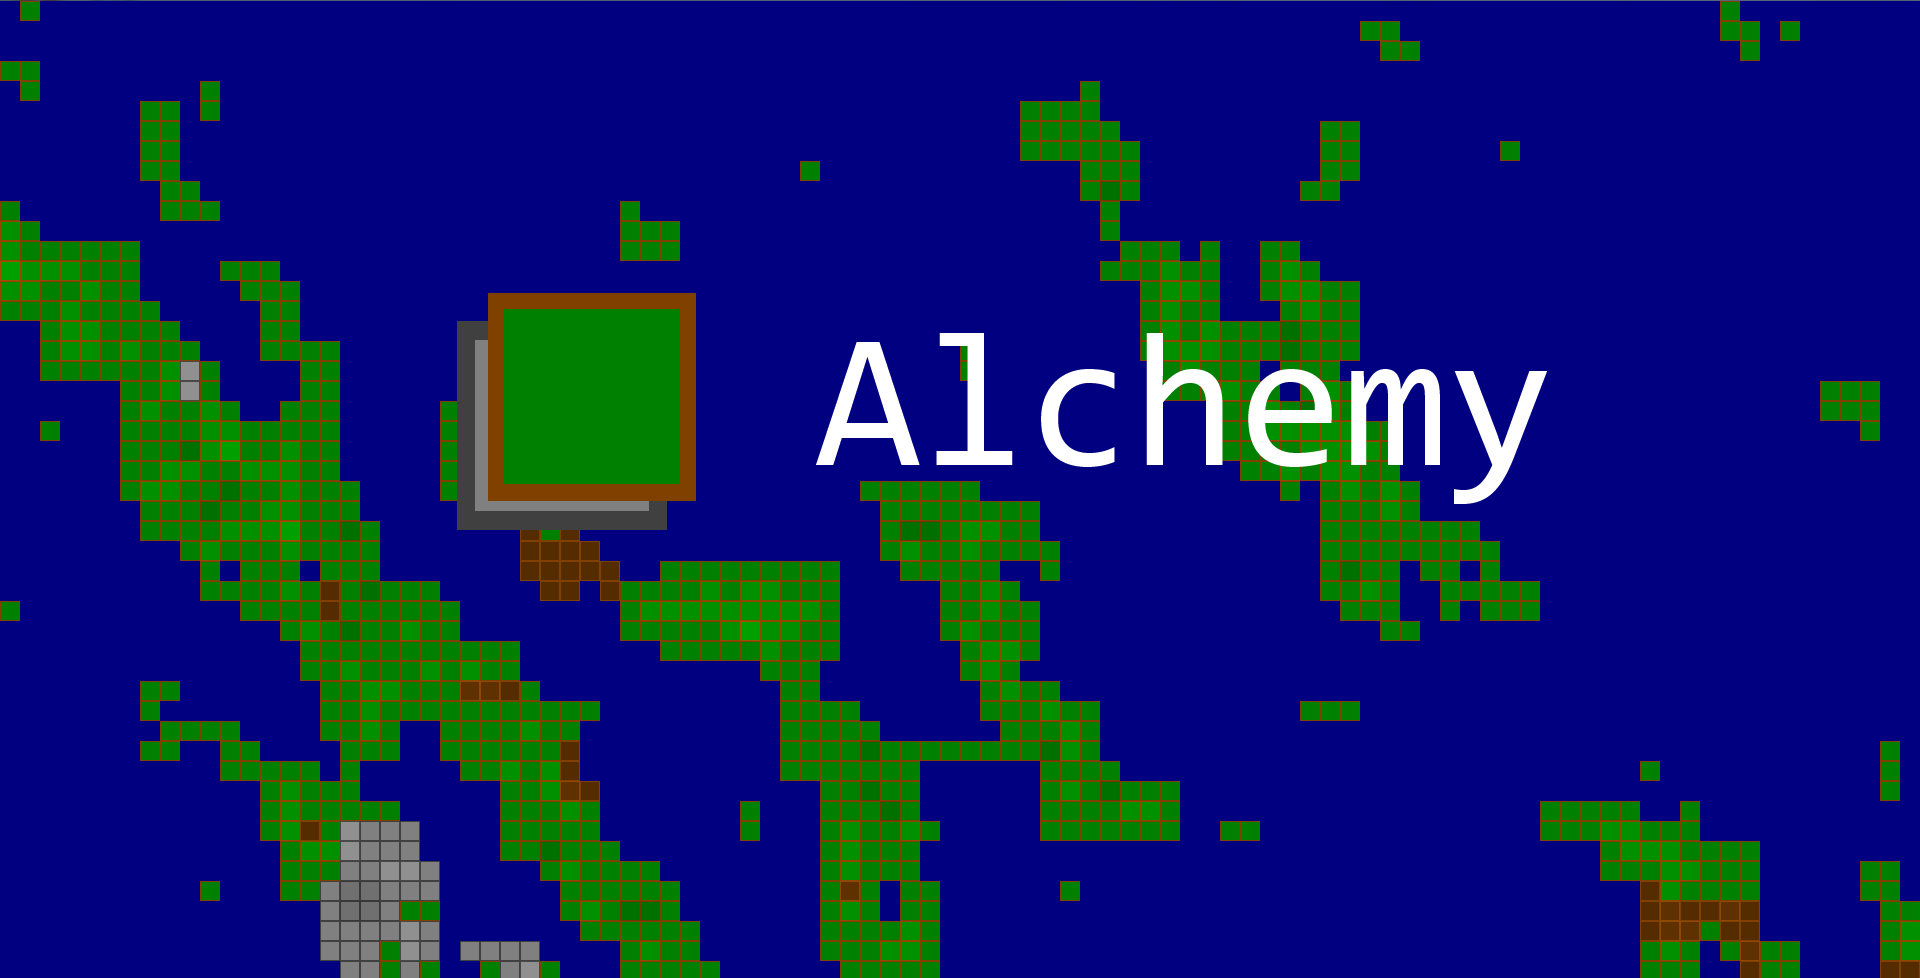
Play Alchemy!
"So fun you won't even need friends!"