Current scientific projects
2011-22 trends in winter PM2.5 in South Korea
Fine particulate matter (PM2.5) is a severe air pollution problem in South Korea and is worst in winter. Strong local emissions controls and emissions reductions upwind have led winter PM2.5 to decline throughout South Korea. However, PM2.5 around Seoul (where half the population lives) has been resistant to decrease and only declined after 2019. With an ensemble of surface observations augmented by machine learning, we find that PM2.5 composition in Seoul has shifted toward two kinds of secondary PM2.5, meaning that they are formed in the atmosphere through chemical reactions rather than emitted directly, and that these species are both resistant to decrease. Both species, particulate nitrate (pNO3-) and secondary organic aerosol (SOA), can be formed by nighttime chemistry. We find that as nitrogen oxide (NOx) pollution (largely from combustion) has declined due to emissions controls, this nighttime chemistry accelerates and increases the formation of pNO3- and SOA. However, pNO3- appears to have begun responding to NOx controls after 2019 and we propose a physical driver of this decrease. We argue that further decreases in NOx combined with reductions in emissions of volatile organic compounds should drive faster pNO3- reductions and also SOA reductions because the nighttime chemistry may decelerate.
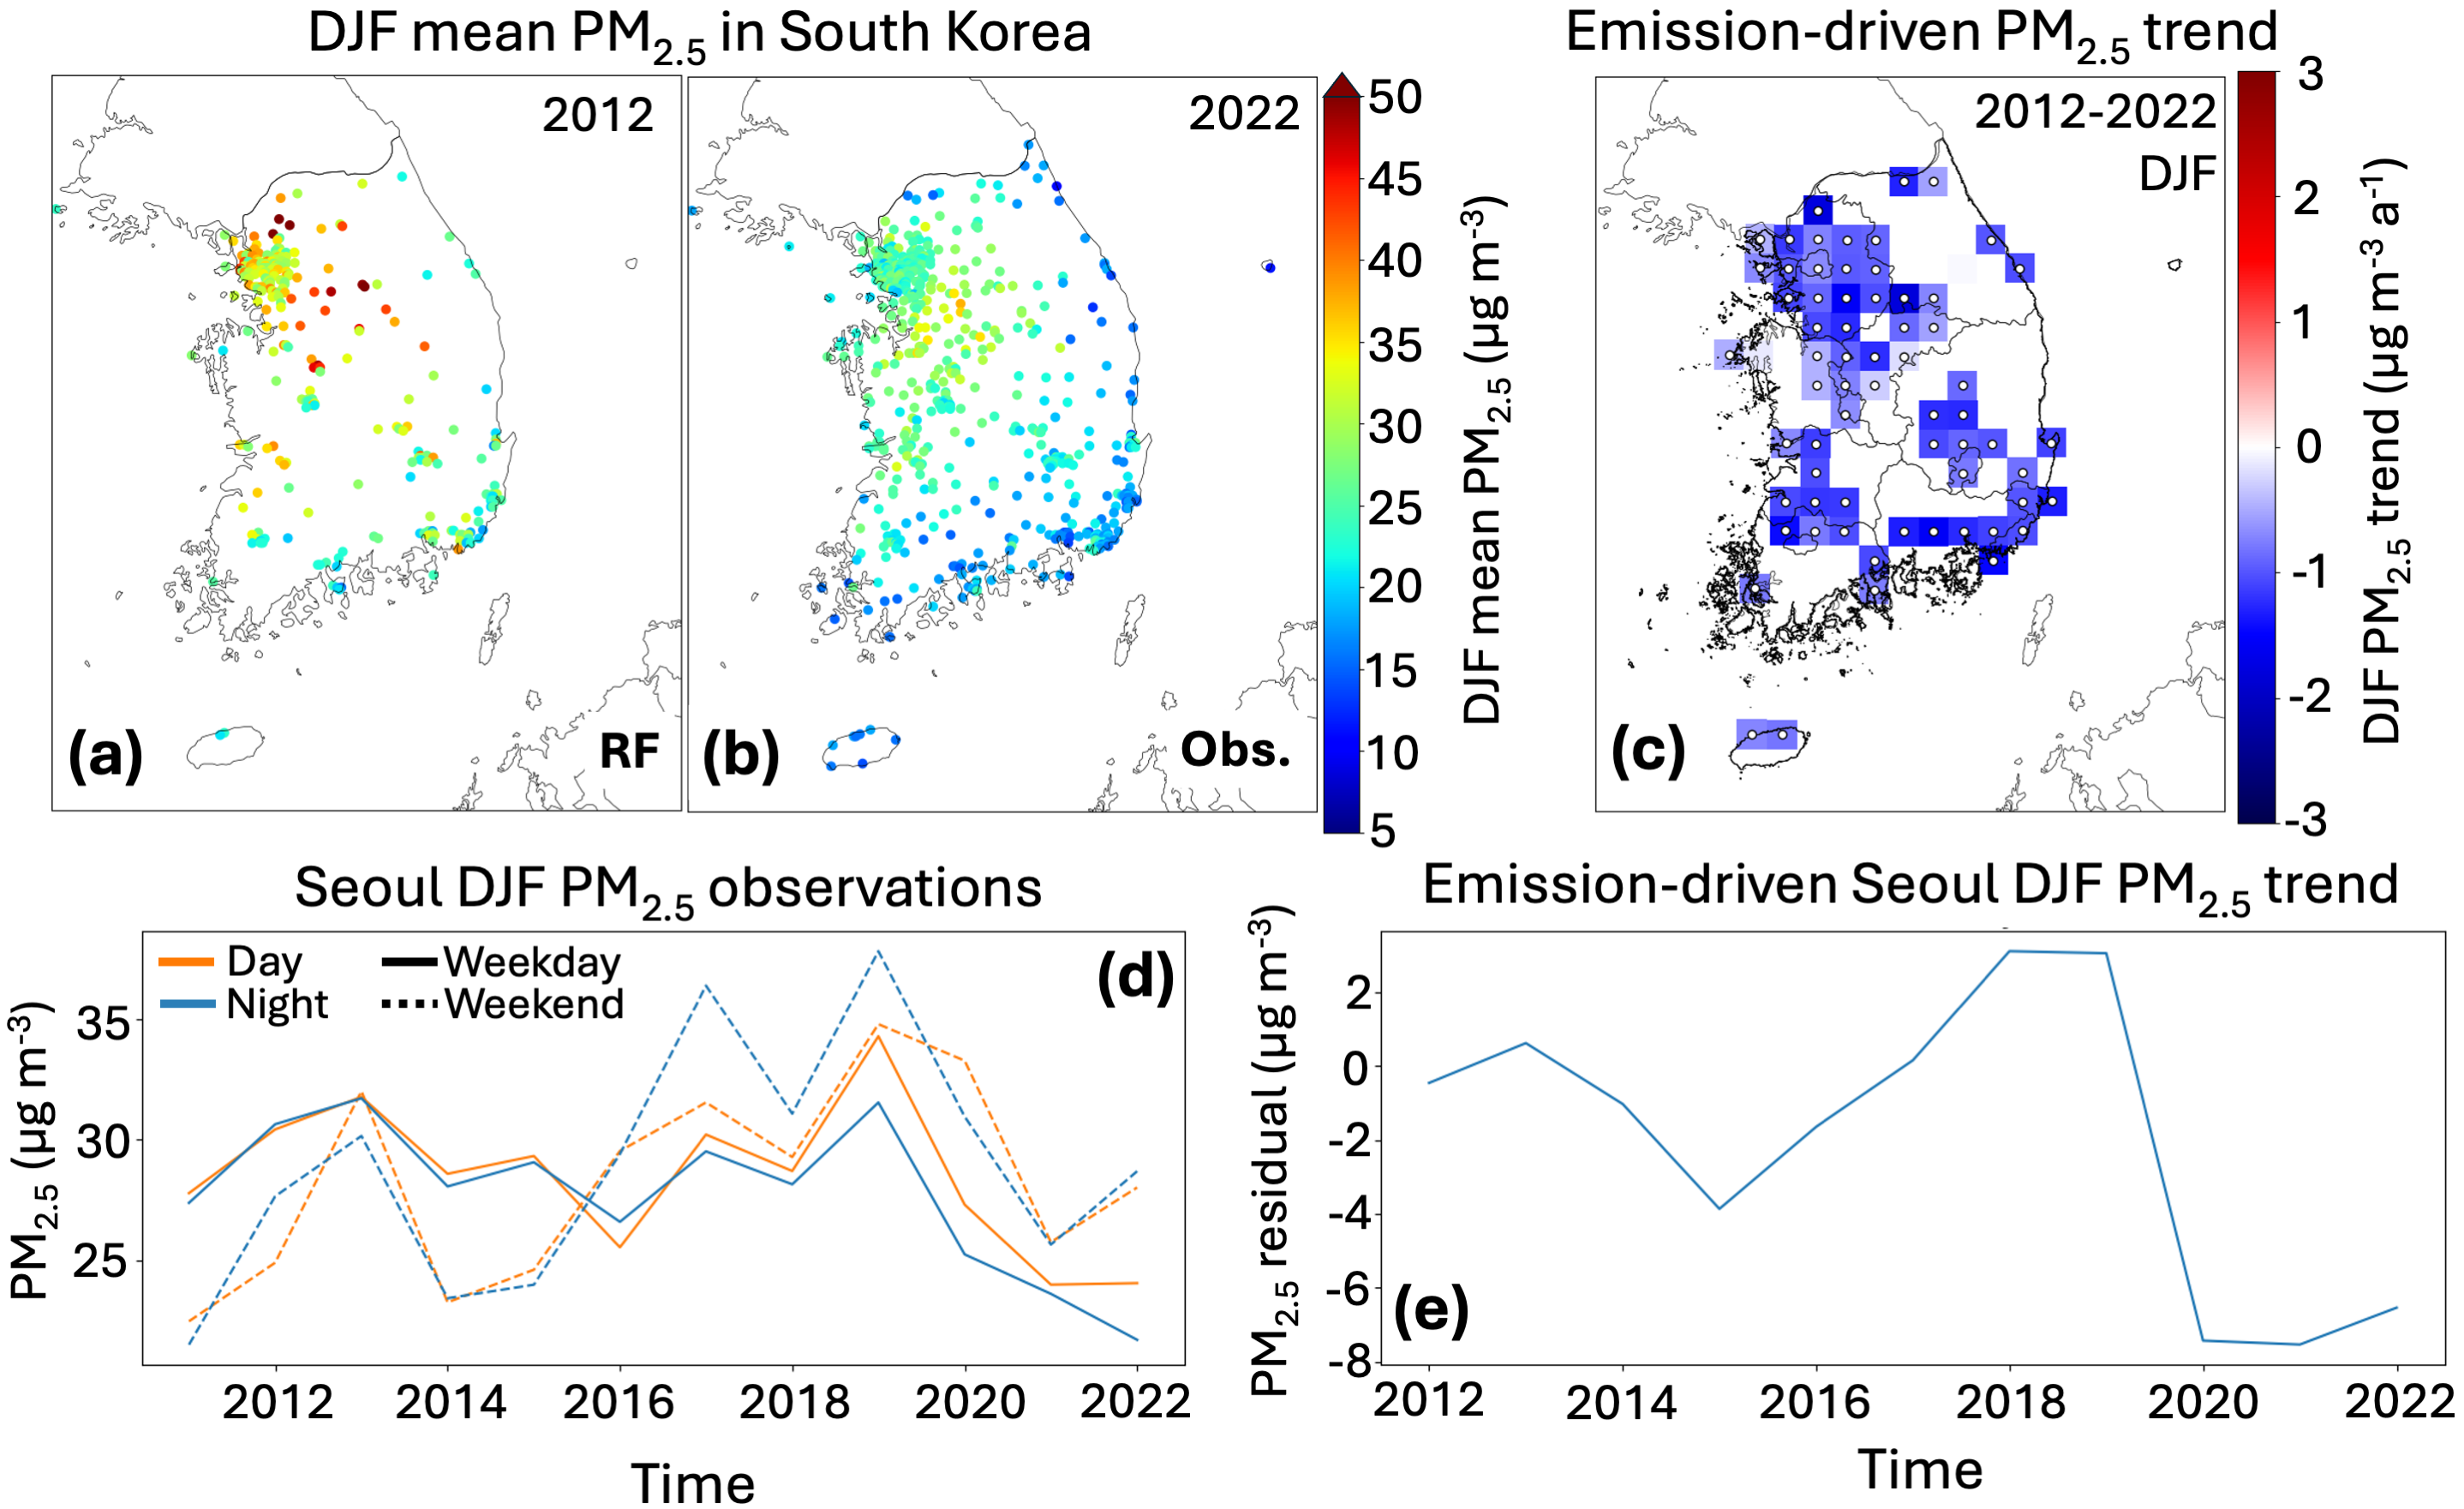
Figure: DJF PM2.5 and trends in South Korea. Panels (a) and (b) show DJF mean PM2.5 at AirKorea surface stations in (a) 2012 and (b) 2022. PM2.5 monitoring at these stations started in 2015, and data for 2012 is from a synthetic PM2.5 network produced using a random forest (RF) algorithm applied to the station data including PM10 (Pendergrass et al., 2025). Panel (c) shows the DJF emission-driven trend in PM2.5 after removing meteorological influence with a multi-linear regression (MLR) fit. Panel (d) shows observed DJF PM2.5 averaged over 25 sites in the city of Seoul, disaggregated into daytime (8-18 LT) and nighttime (22-5 LT) for weekdays and weekends. Panel (e) shows the emission-driven PM2.5 timeseries (residual from the meteorological MLR model) for the Seoul 0.25°×0.3125° grid cell (centered at 37.5°N,127.0°E) and averaging data from 37 sites.
Associated publications and presentations
Pendergrass, D. C., Jacob, D. J., Oak, Y. J., Dang, R., Yang, L. H., Beaudry, E., Colombi, N. K., Zhai, S., Kim, H., Choi, J., Park, J., Kim, S., Li, K., & Liao, H. (2025). Wintertime Trends of Fine Particulate Matter (PM2.5) in South Korea, 2012–2022: Response of Nitrate and Organic Components to Decreasing NOx Emissions. Geophysical Research Letters, 52(19), e2025GL116091. Link to paper (open access). Link to PDF. Read a general audience explainer.
Pendergrass, D. C., D. J. Jacob, Y. J. Oak, R. Dang, L. H. Yang, E. Beaudry, N. K. Colombi, S. Zhai, H. Kim, J.-s. Choi, J.-s. Park, S. Kim, and H. Liao. Interpreting fine particulate matter (PM2.5) trends in South Korea, 2011-2022.
- Gordon Research Conference, Newry, ME, August 2025. Poster.
- American Meteorological Society meeting, New Orleans, La., January 2025. Talk. Slides for talk
Global methane emissions trends and seasonality inferred from satellite observations
Methane is a potent greenhouse gas. It is emitted both from natural sources (largely wetlands) and human sources including livestock, oil and gas, coal, landfills, wastewater and rice, but emissions magnitudes and spatial distributions are uncertain. In this project, we use satellite observations of atmospheric methane to calculate emissions from both human and natural sources. We find that methane emissions surged in 2020 and 2021 before declining in 2022 and 2023. We attribute the surge in large part to emissions from eastern Africa, which experienced large methane-generating floods. We argue that previous work has attributed the methane surge to human-caused emissions (rather than wetlands) because of poor understanding of wetland spatial extent in the tropics. We also find that the seasonal cycle of methane emissions peaks in September, driven by inundation in the tropics, which differs from wetland models.
This project is an application of my CHEEREIO platform for chemical data assimilation. Future work will expand to other greenhouse gases and air pollutants, as well as expand the methane work to higher resolution regional settings.
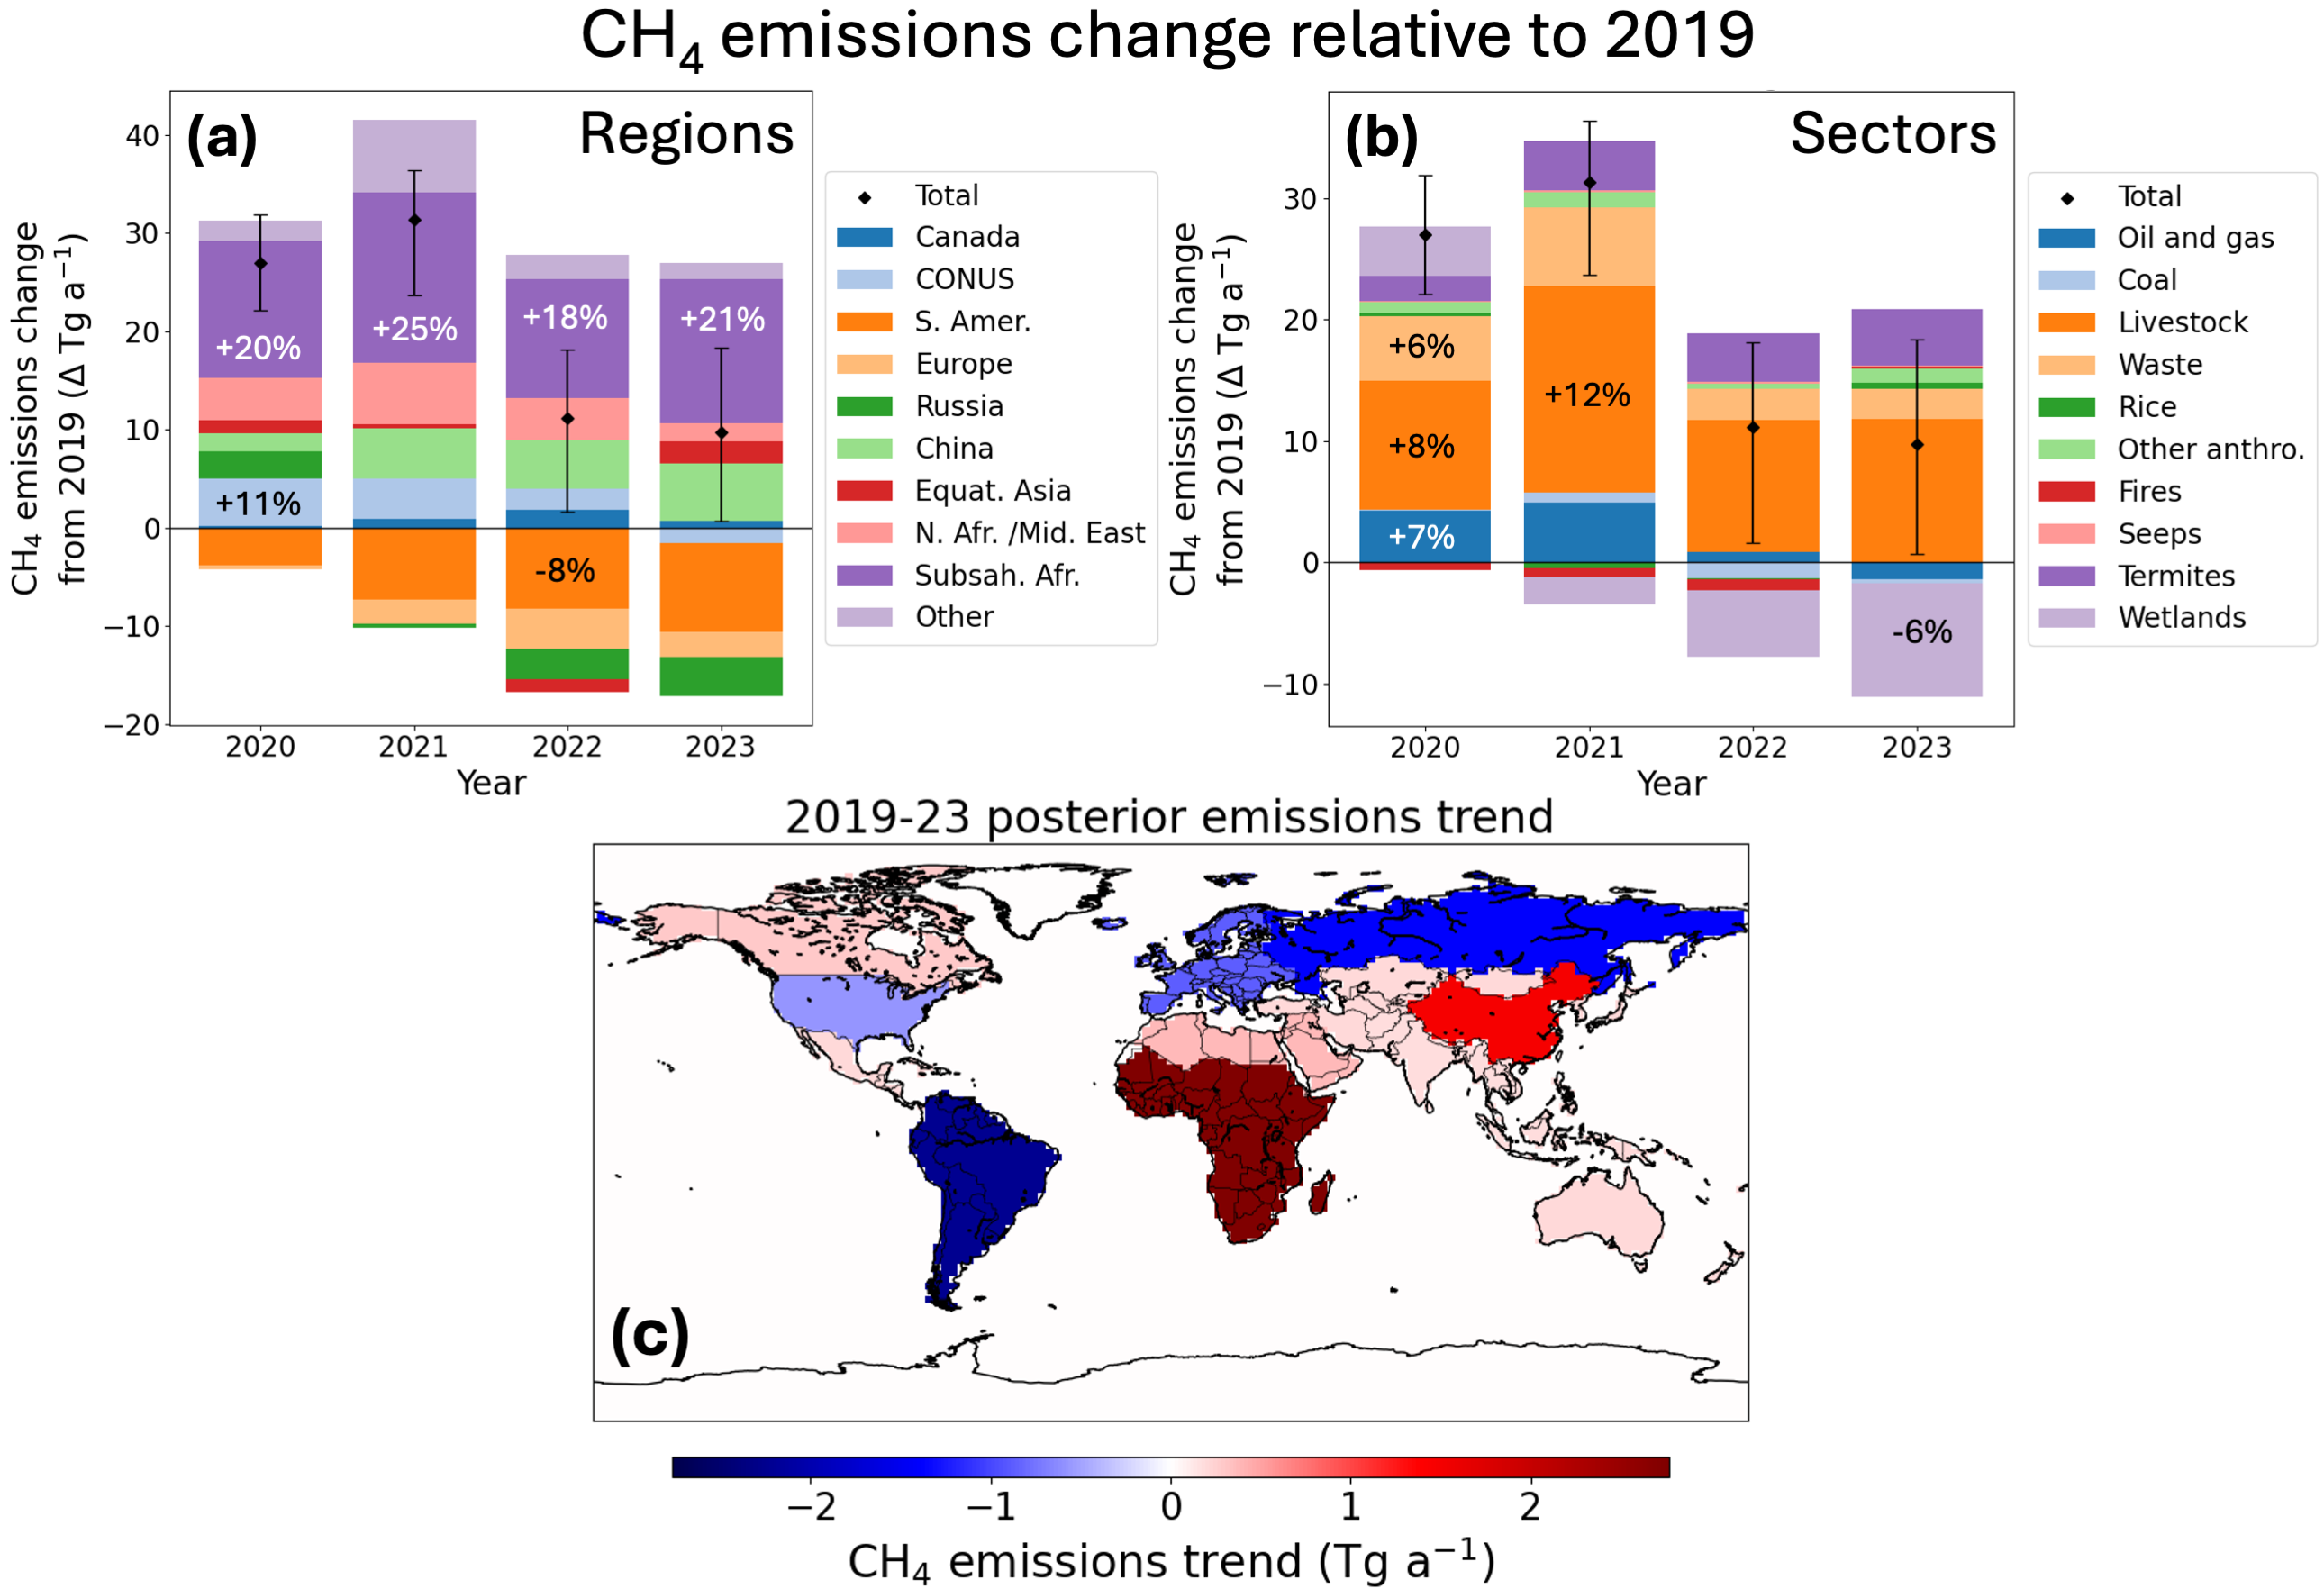
Figure: Annual posterior methane emission trends for 2019-2023 disaggregated by region and sector. Emissions are inferred using a localized ensemble transform Kalman filter applied to TROPOMI satellite observations. Panels (a) and (b) show posterior emission changes relative to 2019, disaggregated by region and sector respectively. Inset percentages show changes relative to 2019 values for selected regions/sectors. Error bars show range of the inversion ensemble for the global emission trend. Panel (c) shows 2019-2023 trends in posterior emissions by region obtained from linear regression.
Associated publications and presentations
Pendergrass, D.C. Jacob, D. J., Balasus, N., Estrada, L., Varon, D. J., East, J. D., He, M., Mooring, T. A., Penn, E., Nesser, H., & Worden, J. R. (2025). Trends and seasonality of 2019–2023 global methane emissions inferred from a localized ensemble transform Kalman filter (CHEEREIO v1.3.1) applied to TROPOMI satellite observations. Atmospheric Chemistry and Physics, 25(21), 14353–14369. Link to paper (open access). Link to PDF. Read a general audience explainer.
Pendergrass, D. C., D. J. Jacob, N. Balasus, L. Estrada, D. J. Varon, T. A. Mooring, J. D. East, E. Penn, and H. O. Nesser. Continuous sub-weekly monitoring of global methane emissions from an ensemble Kalman filter at 2°×2.5° degrees using TROPOMI observations.
- Gordon Research Seminar, Newry, ME, August 2025. Poster.
- American Geophysical Union Fall Meeting, Washington, D.C., December 2024. Poster. PDF of AGU poster.
- 11th International GEOS-Chem Meeting (IGC11), St. Louis, Mo., June 2024. Poster. PDF of IGC poster.
CHEEREIO: An open-source tool for chemical data assimilation
CHEEREIO) is a tool that allows scientists to use observations of pollutants or gases in the atmosphere, such as from satellites or surface stations, to update supercomputer models that simulate the Earth. Other scientists have assembled estimates of emissions of various pollutants from around the world, but our emissions estimates are very uncertain. CHEEREIO uses a model called GEOS-Chem to simulate what the atmosphere would look like if those emissions estimates were correct, and then compares those estimates to the real atmosphere as observed by satellites or equipment on the Earth’s surface. CHEEREIO uses the difference between the model simulation and the real world to update our maps of emissions.
In more technical terms, CHEEREIO implements the localized ensemble transform Kalman filter (4D-LETKF) for the GEOS-Chem chemical transport model (CTM). It optimizes emissions and concentrations for target trace gases, accounting for uncertainties in the emissions inventories and the observations. 4D-LETKF uses an ensemble of CTM simulations, each driven by randomly perturbed emissions such that the ensemble represents the spread of atmospheric states given the range of possible emissions. The ensemble evolves through an assimilation window after which the mean posterior state vector is calculated and used to construct a new ensemble of state vectors. 4D-LETKF is widely used for inverse problems in atmospheric chemistry, and CHEEREIO is already used by research groups in the US, Canada, the UK, and China on emissions of CO, CH4, NH3, C2H6, and NOx at multiple spatial and temporal scales. CHEEREIO supports multi-constituent inversions, full posterior error calculation, and simultaneous optimization of emissions and concentrations.
Code and documentation are available on Github and ReadTheDocs, both linked from the official site. CHEEREIO and all its components are open-source.
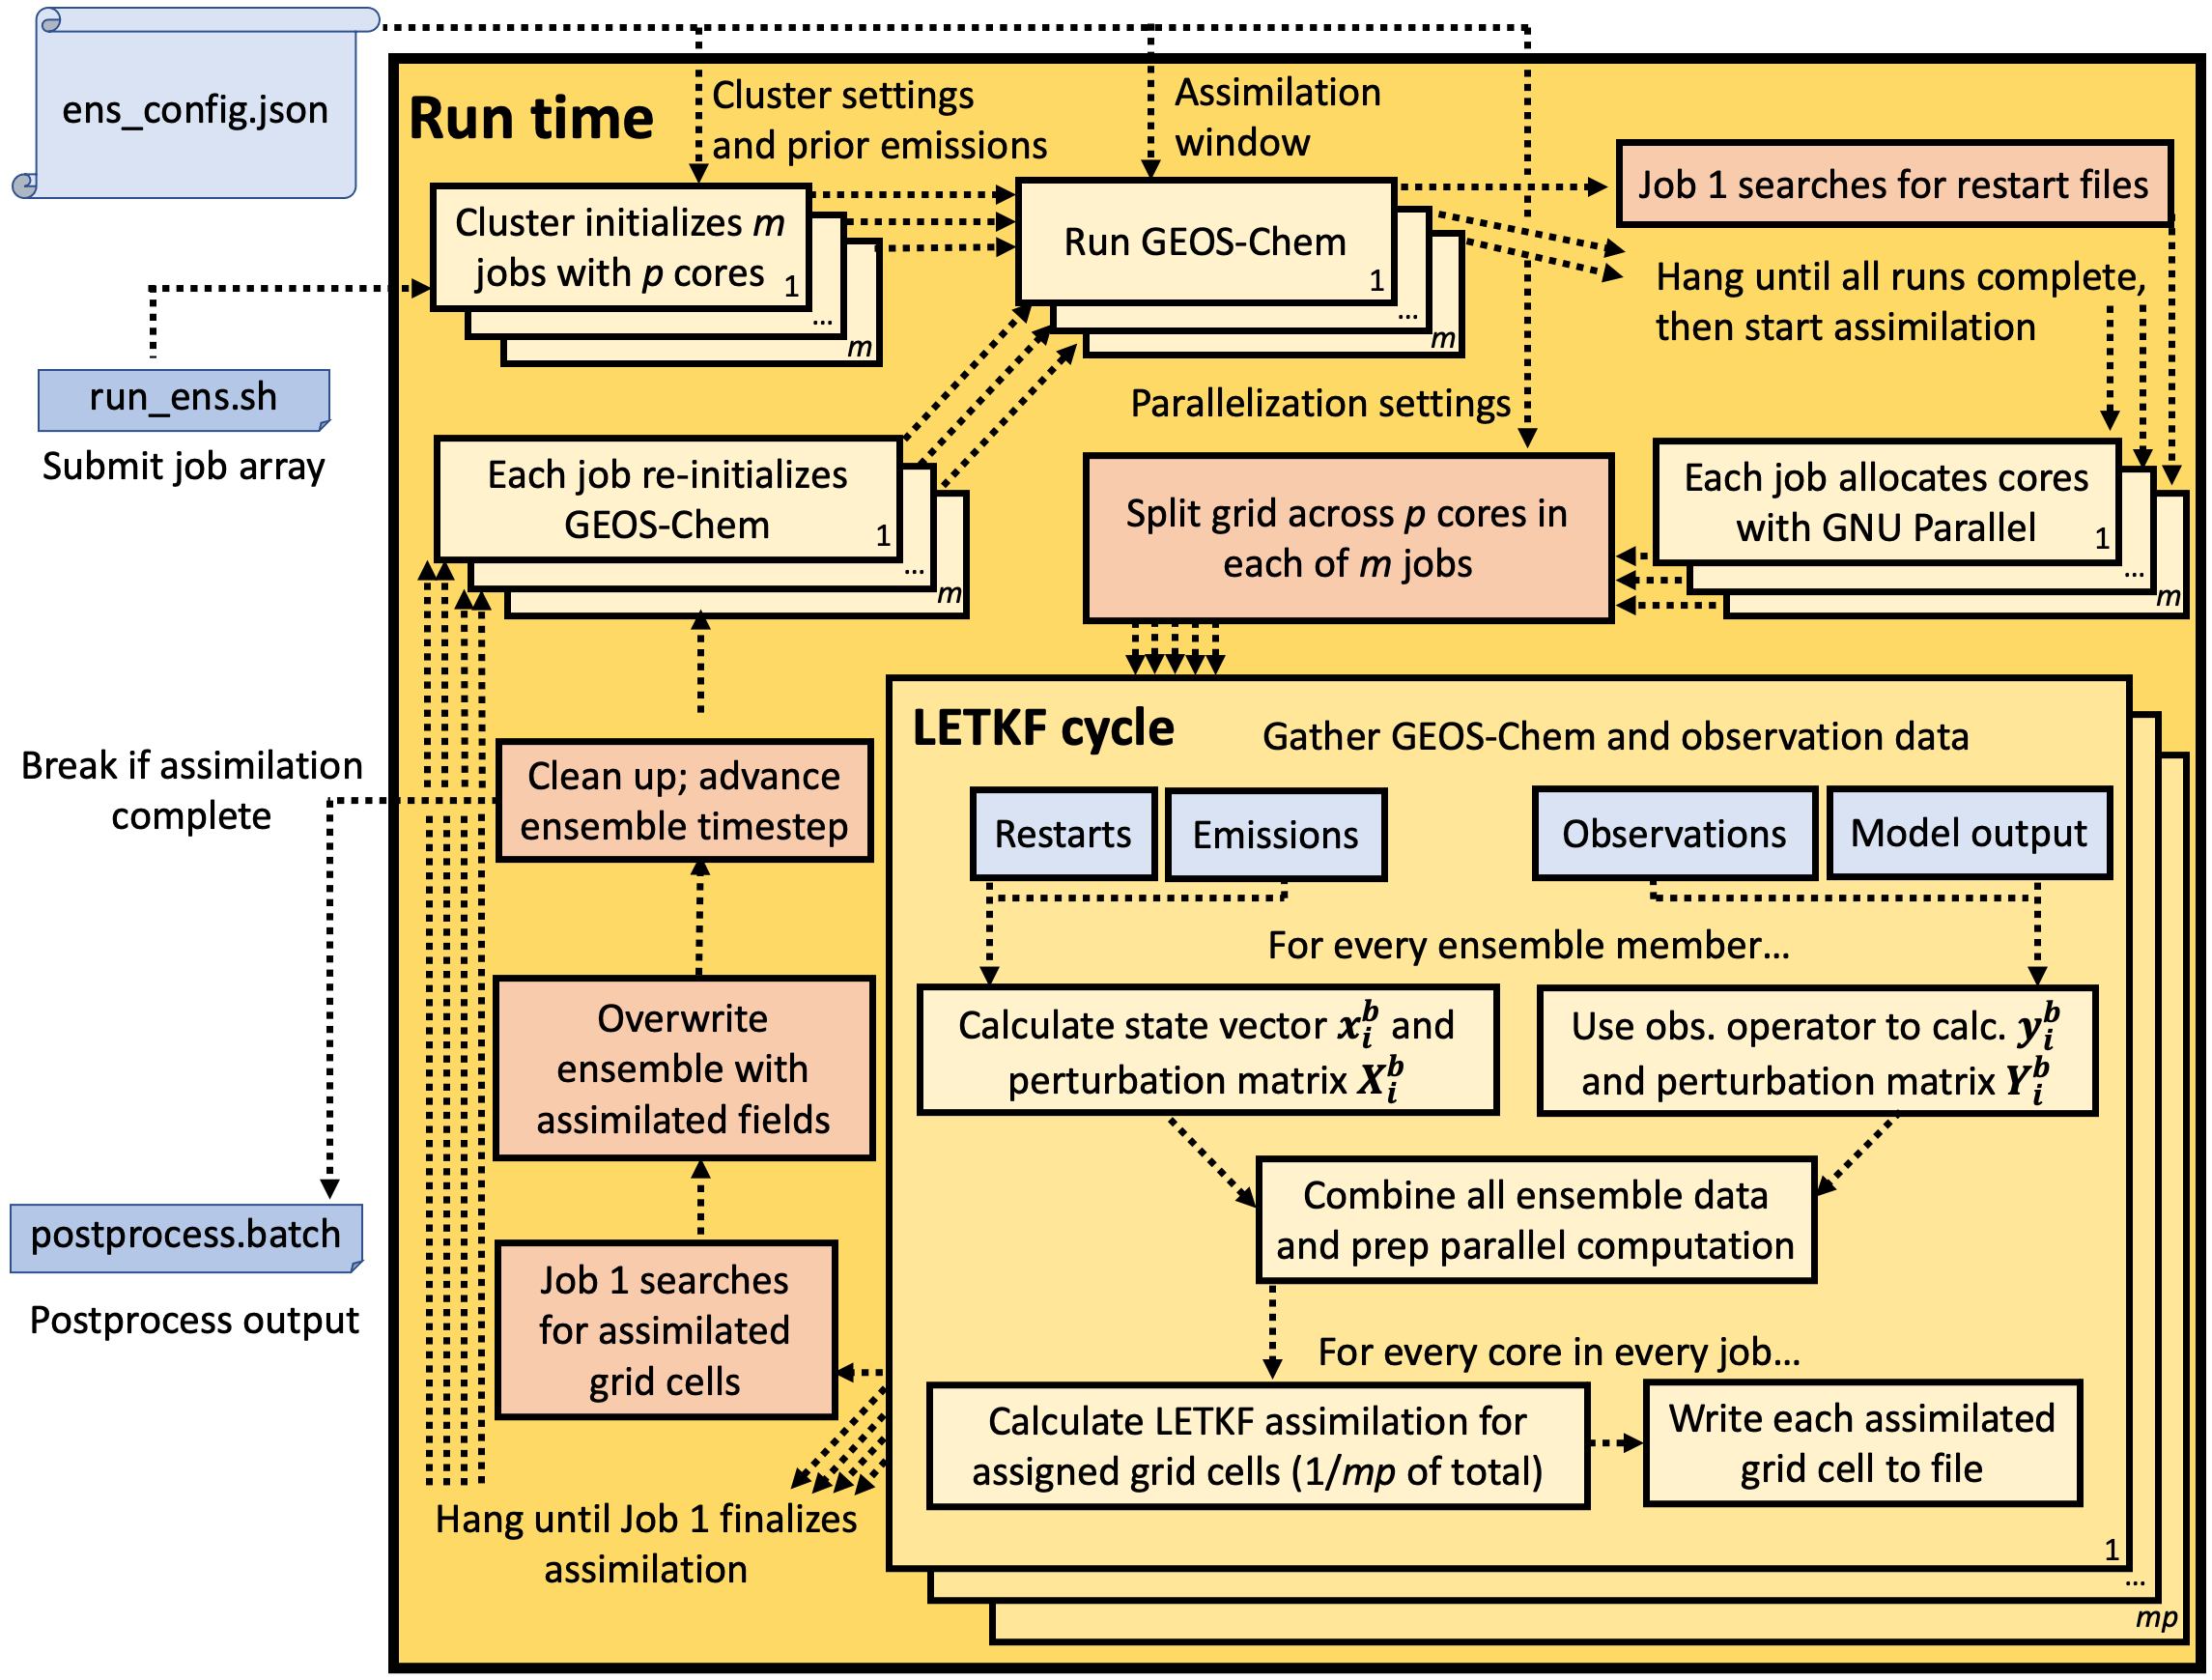
Figure: Schematic of CHEEREIO runtime routines and job control procedures. CHEEREIO is run as an array of m separate jobs on a computational cluster, one for each ensemble member. These m jobs, operating in parallel, alternate between running GEOS-Chem and running the LETKF algorithm for a subset of grid cells, as shown by the light yellow boxes; the m jobs are coordinated by a single job controller shared by the entire ensemble (shown in light red), ensuring that the ensemble remains synchronized. Boxes in blue show data input into CHEEREIO processes.
Associated publications and presentations
Pendergrass, D. C., Jacob, D. J., Nesser, H., Varon, D. J., Sulprizio, M., Miyazaki, K., & Bowman, K. W. (2023). CHEEREIO 1.0: A versatile and user-friendly ensemble-based chemical data assimilation and emissions inversion platform for the GEOS-Chem chemical transport model. Geoscientific Model Development, 16(16), 4793–4810. Link to paper (open access). Link to PDF. Read a general audience explainer.
Pendergrass, D.C. Jacob, D. J., Balasus, N., Estrada, L., Varon, D. J., East, J. D., He, M., Mooring, T. A., Penn, E., Nesser, H., & Worden, J. R. (2025). Trends and seasonality of 2019–2023 global methane emissions inferred from a localized ensemble transform Kalman filter (CHEEREIO v1.3.1) applied to TROPOMI satellite observations. Atmospheric Chemistry and Physics, 25(21), 14353–14369. Link to paper (open access). Link to PDF. Read a general audience explainer.
Voshtani, S., Jones, D. B. A., Wunch, D., Pendergrass, D. C., Wennberg, P. O., Pollard, D. F., Morino, I., Ohyama, H., Deutscher, N. M., Hase, F., Sussmann, R., Weidmann, D., Kivi, R., García, O., Té, Y., Chen, J., Anderson, K., Stevens, R., Kondragunta, S., … Murata, I. (2025). Quantifying CO emissions from boreal wildfires by assimilating TROPOMI and TCCON observations. Atmospheric Chemistry and Physics, 25(21), 15527–15565. Link to paper (open access).
Pendergrass, D. C., D. J. Jacob, H. O. Nesser, D. J. Varon, M. Sulprizio, K. Miyazaki, and K. W. Bowman (2022). CHEEREIO: a generalized, open-source ensemble-based chemical data assimilation and emissions inversion platform for the GEOS-Chem chemical transport model.
- American Geophysical Union Fall Meeting, Chicago, Ill., December 2022. Poster. PDF of AGU poster.
- GEMS science meeting, Seoul, S. Korea, November 2022. Talk. Slides for Seoul talk.
- 10th International GEOS-Chem Meeting (IGC10), St. Louis, Mo., June 2022. Talk. Slides for St. Louis talk.
Other current projects
Writing
I freelance for a variety of outlets, including Harper's and The Guardian. Some of my articles are linked here. Currently, I am at work on (1) a sci-fi novel, and (2) a second book with historian Troy Vettese on economic democracy.
Data assimilation video game
I am at work on a Java-based video game where you play as a corrupt weather forecaster. By intentionally sabotaging meteorological data, you alter forecasts to favor your mysterious benefactors. Think Papers Please meets NCVIEW. More information soon!
Newsletter
Archived science projects
Extreme value theory applied to environmental science
Extreme value theory is a branch of statistics dedicated to the analysis of outliers and rare events. In environmental science, extremes are sometimes more important than measures of central tendency: for example, bridge builders care more about the maximum height of a river than its mean height. I've used extreme value theory to link winter meteorology in Beijing to severe smog events, which can shut down the city and are a major threat to public health. If you are interested in using this methodology in your own research, send me an email (drew@drewpendergrass.com) and we can collaborate.
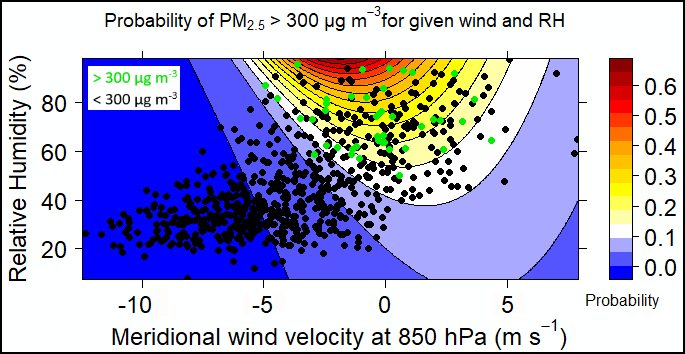
Figure: Probability (given in colored contours) for PM2.5 in Beijing to exceed 300 μg m-3 given relative humidity and 850-hPa meridional winds. Actual observations are overlaid on top: green dots represent days that exceeded 300 μg m-3, and black dots represent the rest.
Associated publications and presentations
Pendergrass, D. C., Shen, L., Jacob, D. J., & Mickley, L. J. (2019). Predicting the Impact of Climate Change on Severe Wintertime Particulate Pollution Events in Beijing Using Extreme Value Theory. Geophysical Research Letters, 46(3), 1824–1830. Publisher's version (open access). PDF.
Pendergrass, D. C., L. Shen, D. J. Jacob, and L. J. Mickley. Predicting the impact of climate change on severe winter haze pollution events in Beijing using extreme value theory. American Geophysical Union Fall Meeting, Washington D.C., December 11, 2018. Talk. Slides.
Using machine learning and satellite data to map fine particulate matter pollution in east Asia
Fine particulate matter (PM2.5) is an air pollutant associated with millions of deaths per year. Measurements of this pollutant are made at surface sites throughout east Asia, but the vast majority of surface area has no available measurements. Additionally, many areas only have observations starting recently (e.g. after 2015). This means that we can't fully evaluate the impact PM2.5 has on public health. Satellites offer a solution since they image a wide area at once. A geostationary satellite instrument called GOCI has been imaging east Asia 8 times per day. One of the measurements GOCI takes is called Aerosol Optical Depth (AOD), which is a measure of the transparency of the atmosphere. AOD is related to surface PM2.5 but the relationship is complicated; for example, the satellite measures a column of air all at once, and it cannot tell if pollution is high in the sky or on the ground, where humans can inhale it. This project uses machine learning to link AOD, meteorology, and other data to measured surface PM2.5 in east Asia.
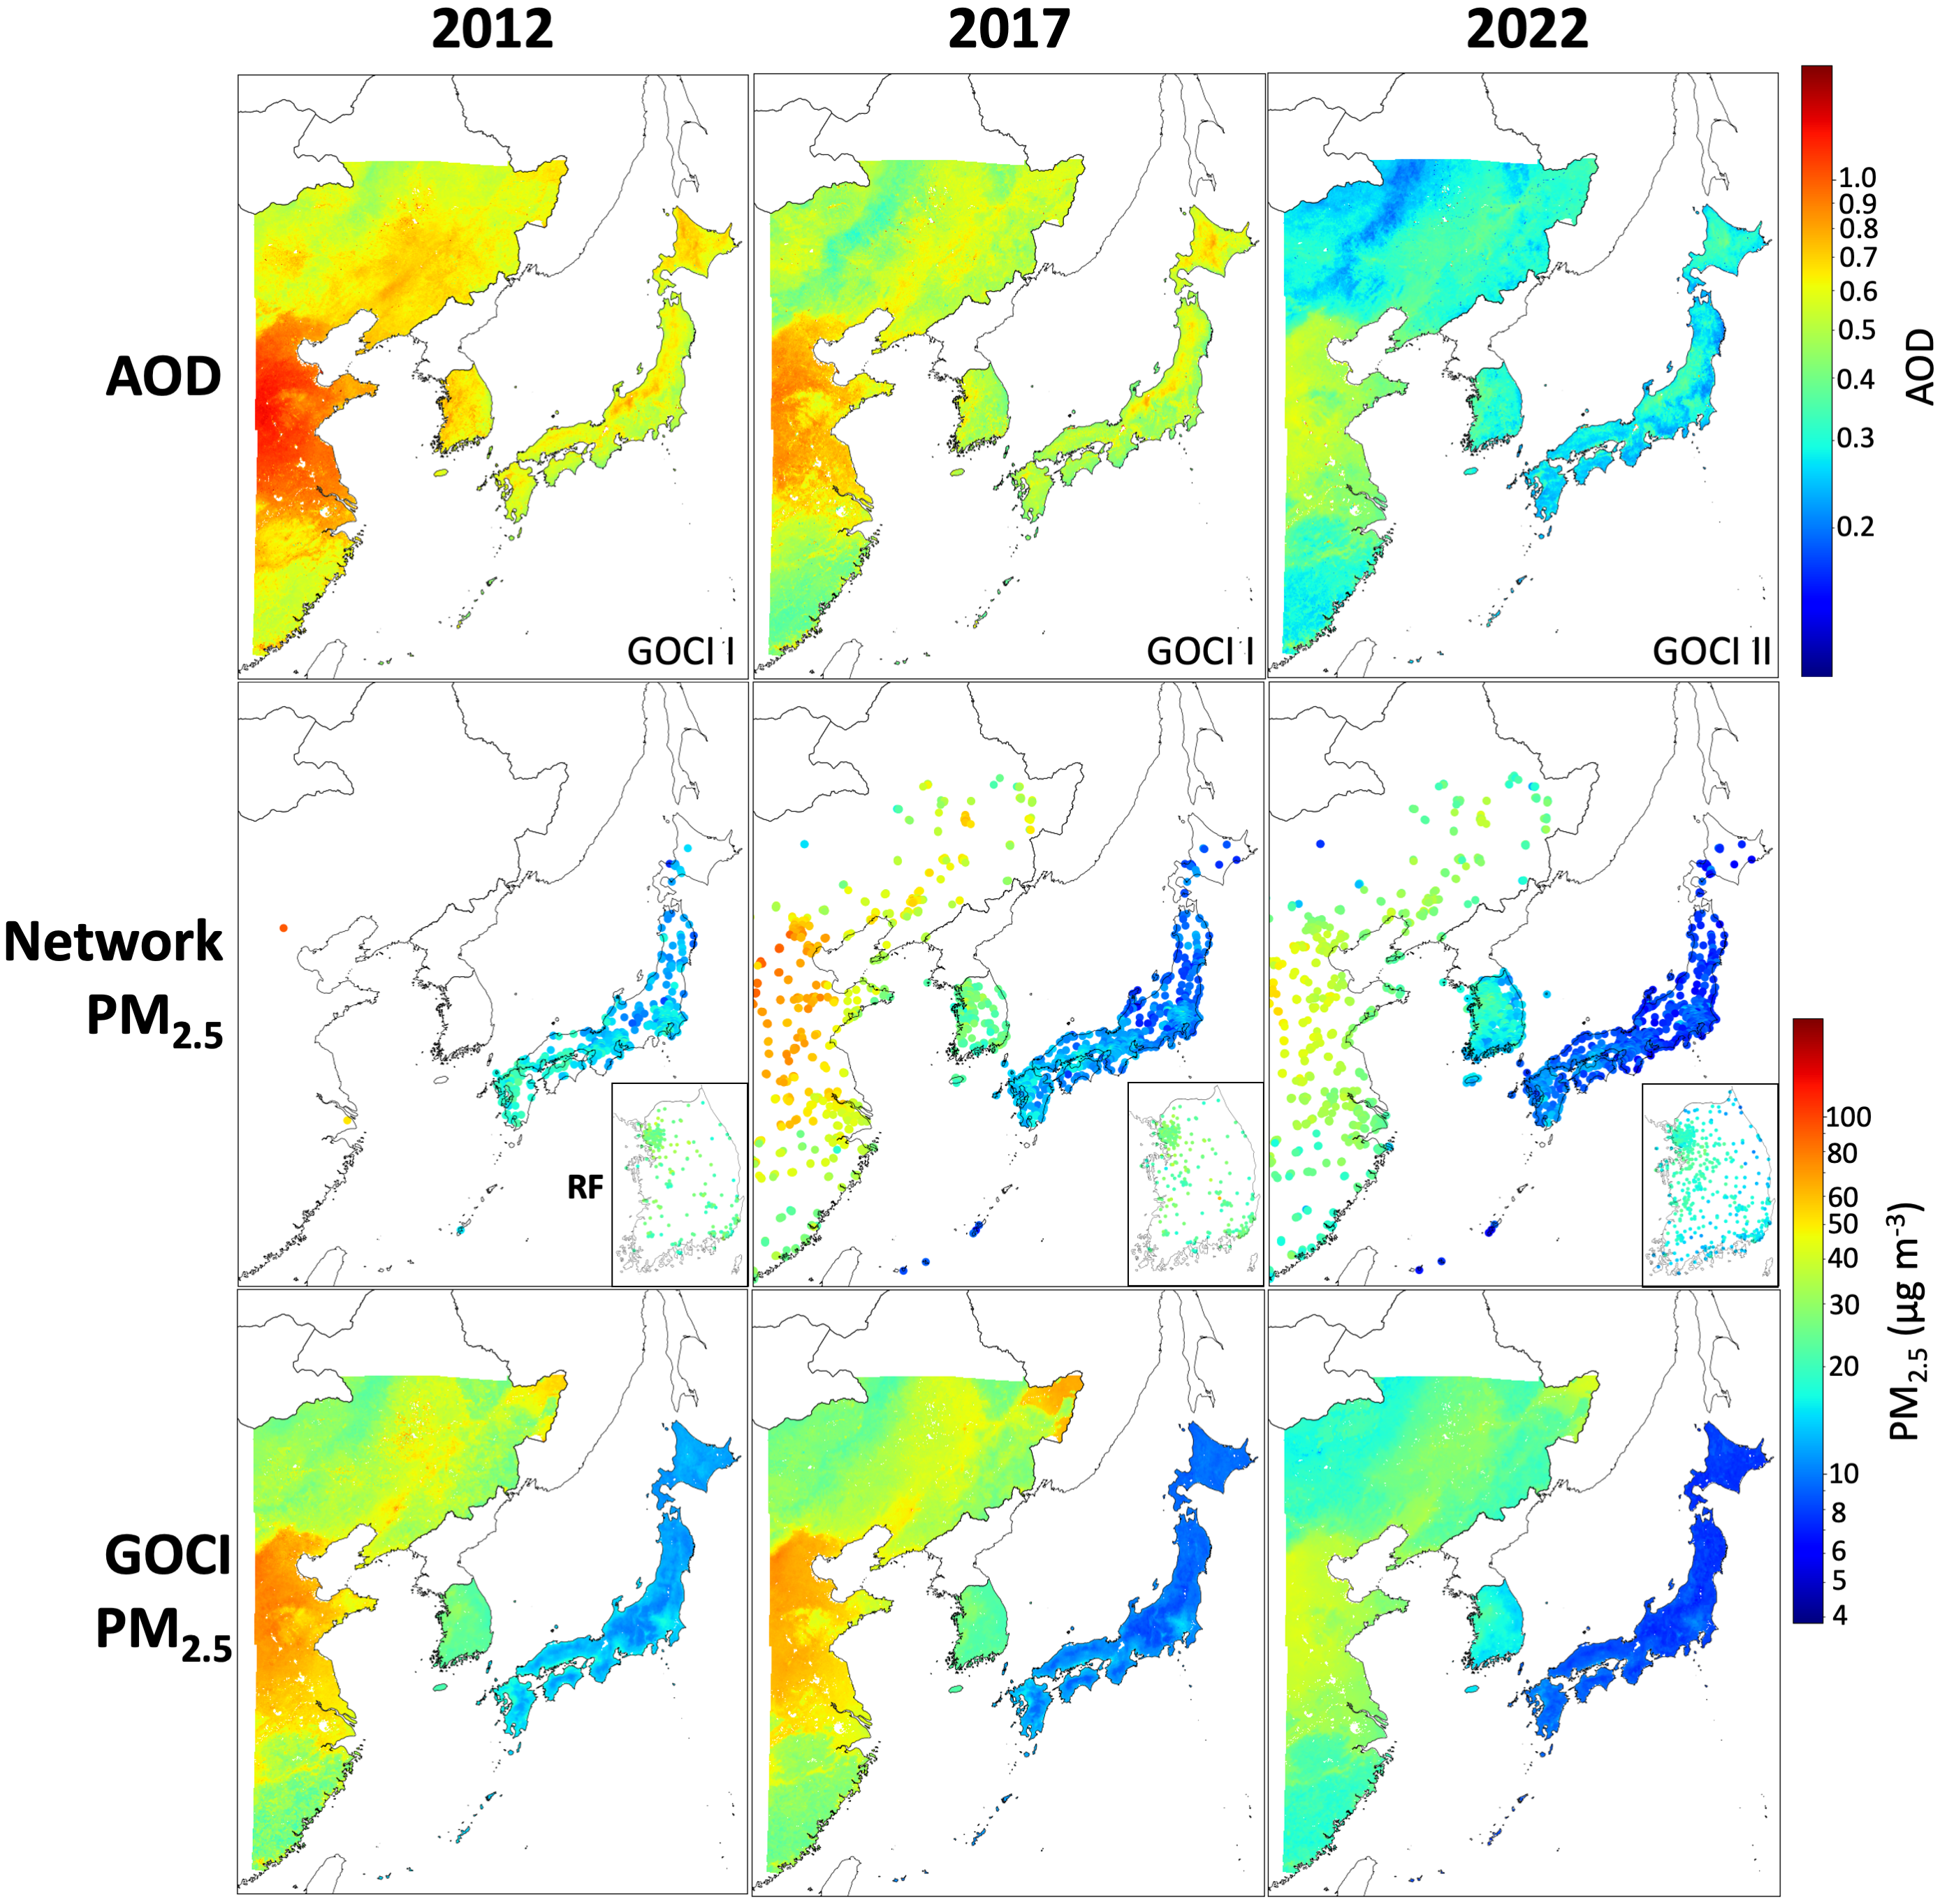
Figure: GOCI gap-filled aerosol optical depth (AOD), PM2.5 from air quality networks, and GOCI PM2.5 obtained by applying a RF algorithm to the GOCI AOD data. Data are annual means for 2012 (the first year with complete GOCI data), 2017, and 2022. The gap-filled AOD data provide continuous 2×2 km2 coverage of eastern China, S. Korea, and Japan for 2011-2022. The PM2.5 network data are from individual sites and enlarged for visibility. The S. Korea insets in the middle panels provide greater resolution of network data gaps. PM2.5 measurements from the AirKorea network started in 2015, and the S. Korea PM2.5 network data shown for 2012 are from a RF reconstruction.
Associated publications and presentations
Pendergrass, D.C., Jacob, D. J., Oak, Y. J., Lee, J., Kim, M., Kim, J., Lee, S., Zhai, S., Irie, H., & Liao, H. (2025). A continuous 2011–2022 record of fine particulate matter (PM2.5) in East Asia at daily 2-km resolution from geostationary satellite observations: Population exposure and long-term trends. Atmospheric Environment, 346, 121068. Link to paper (open access). Link to PDF. Read a general audience explainer.
Pendergrass, D. C., S. Zhai, J. Kim, J-H. Koo, S. Lee, M. Bae, S. Kim, H. Liao, and D. J. Jacob. (2022). Continuous mapping of fine particulate matter (PM2.5) air quality in East Asia at daily 6x6 km2 resolution by application of a random forest algorithm to 2011-2019 GOCI geostationary satellite data. Atmospheric Measurement Techniques, 15, 1075–1091. PDF. Publisher's version (open access). Associated dataset available from Dataverse. Video of 15-minute oral presentation at AGU.
Pendergrass, D. C., D. J. Jacob, Y. Oak, J. Kim, J. Lee, S. Lee, S. Zhai, and H. Liao. High spatiotemporal resolution trends of fine particulate matter (PM2.5) in East Asia inferred from the GOCI geostationary instrument, 2011-2022.
- GEMS science meeting, Jeju, S. Korea, September 2023. Talk. Slides for GEMS talk.
- American Meteorological Society annual meeting, Baltimore, Md., February 2024. Poster. PDF of AMS poster
Pendergrass, D. C., D. J. Jacob, S. Zhai, J. Kim, J-H. Koo, M. Bae, and S. Kim. Continuous Mapping of Fine Particulate Matter (PM2.5) Air Quality in East Asia by Application of a Random Forest Algorithm to GOCI Geostationary Satellite Data.
- American Geophysical Union Fall Meeting, New Orleans, La., December 13, 2021. Talk. Slides. Video of 15-minute oral presentation.
- GEMS science meeting, Seoul, S. Korea, October 2022. Poster. PDF of GEMS poster.
Emissions and concentrations of pollutants in China
Pollutants like tropospheric ozone and fine particulate matter (PM2.5) cause serious public health burdens, especially in eastern China. In response to the severe smog problems, the Chinese government implemented the Action Plan on Air Pollution Prevention and Control in 2013. The plan led to rapid reductions in emissions of ozone precursors like NOx and aerosol precursors like SO2. However, observations show that while PM2.5 has decreased, surface ozone has increased, even though emissions have fallen. This project seeks to understand the PM2.5/ozone tradeoff both in the present day and under various models of the future.
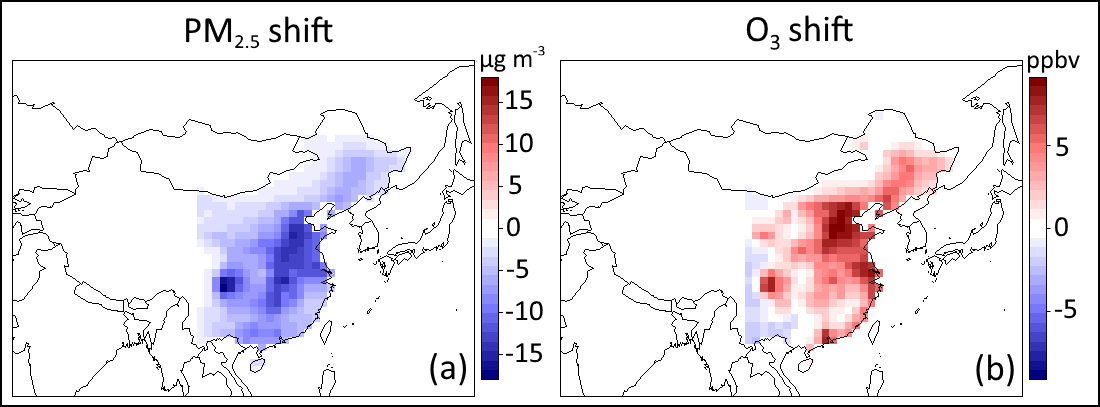
Figure: Air quality changes due to strong NTCF emission reductions in China by midcentury (2045-54); PM2.5 is projected to improve due to modeled emissions mitigation while ozone is projected to worsen.
Associated publications and presentations
Pendergrass, D. C., L.W. Horowitz, and V. Naik. Modeling impact of strong regulation of near-term climate forcers in China on mid-21st century air quality and climate using the GFDL-ESM4 coupled model. American Geophysical Union Fall Meeting, San Francisco, Calif., December 13, 2019. Talk. Slides.
Other archived projects
Musical Composition
I am a composer of modern and experimental music, though I haven't written much in a while. You can learn more about my compositions on my music website and you can listen to my works on my SoundCloud.
Log on wheels
A hot new startup that sells logs on wheels for personal transporation.
Half-Earth Socialism: A Planetary Crisis Planning Game
The Half-Earth Socialism planning game allows anyone to try their hand as a global planner of a post-capitalist science fiction society. The player aims to overcome the environmental crisis, global poverty and inequality, and pursue other goals, all while keeping global parliament happy (else the player will find themselves out of a job, or worse). Consider it a sandbox where you can play with a wide range of technologies and policies spanning different fields and ideologies. The game simulates the impact of your decisions by calculating emissions and using a real climate model (HECTOR) to work out the climate effects, while also simulating impacts to the food system and biodiversity, among other natural systems.
The video game is based on my book, Half-Earth Socialism. For more, you can visit the book homepage or play the game for free in your browser (mobile/desktop both supported)!

Half-Earth Socialism
A book from Verso, co-authored with environmental historian Troy Vettese, on how we can get out of our current ecological mess. The book comes with a video game, linked from my Games page. Published in April 2022. You can order it from the publisher here.

Alchemy
Alchemy is a single-player military strategy game written in Java. More on the game's website here.

